During the first year and a half of the project, we introduced many times the task of Conflict Detection and Resolution. After the Advisory Board workshop, in which ARTIMATION refined the concept of a new conflict visualisation, the final version of the protocol was developed and on July 11th the first validation activities started.
The concept
ARTIMATION aims to understand how a brand new kind of visualisation of an AI outcome can influence the human performance of the Air Traffic Controllers, taking also into account the acceptance from the end users. The project used the Genetic Algorithm, developed in ENAC, as a starting point on which build the innovative visualisation. ARTIMATION developed then 3 different kinds of visualisation to test: a Black Box, where no explanation through the interface was given; a Heat Map, where all the possible solutions were showed on the radar screen through heat maps with different colours, green representing go areas, and red representing no-go areas; and a Storyboard, taking advantage of the Heat Map and organising a sequence of actions to solve the conflict too. Even if this kind of visualisation differs a lot from the standard used in Air Traffic Control nowadays, ARTIMATION wanted to investigate a different way to visualise an AI outcome, without anchoring to the traditional visualisation.
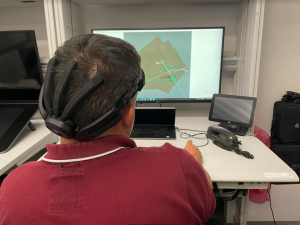
Represantatives from Deep Blue and Sapienza University joined ENAC in Toulouse to start validating the new Conflict Detection and Resolution visualisation. The first week of simulations involved 9 ATM experts, and 1 ATM students. In the following weeks, ARTIMATION validated the new visualisation concept with other ATM students, to be able to draw some differences between experts and students, gathering important feeback on the usefulness of the tool not only in an operative environment, but also for training purposes. The project developed different self-report ad-hoc questionnaires to assess the acceptance and the human performance related to the different visualisations, contemporarily measuring the stress, workload, and approach-withdrawal of the Air Traffic Controllers when using the tool.
The results will be available in October, stay tuned to understand the differences between experts and students when using a new visualisation tool!